
In today’s fast-changing world of online retail, live shopping has become a game-changing way to sell products. It’s more than just selling – it’s about creating an exciting, interactive experience where viewers can watch, engage, and buy products in real-time. Think of it like a TV shopping channel, but with a modern, digital twist that happens right on your smartphone or computer.
But here’s the challenge: how do you know if your live shopping events are actually working? This is where key performance indicators, or KPIs, become super important.

Imagine trying to drive a car without a dashboard. You wouldn’t know how fast you’re going, how much fuel you have, or if something is wrong with the engine. Similarly, live shopping without the right KPIs is like driving blindfolded. You might be moving, but you have no idea if you’re heading in the right direction.
Live shopping is different from traditional online shopping. It’s not just about putting a product on a webpage and hoping someone buys it, it’s a dynamic experience. Given that it’s a distinctly different experience from traditional eCommerce, the choice of KPIs to measure its performance must reflect its unique characteristics.
The KPIs relevant for measuring the effectiveness of a Live Shopping marketing campaigns are varied and depend on the objectives and results one aims to achieve.
In this blog post, we will examine 3 families of KPIs that are crucial for effectively quantifying the performance of Live Shopping.
Measuring audience interest: Awareness
The first step in assessing the overall success of a Live Shopping strategy is to measure the reach of the live broadcast. In addition, given that Live Shopping is a video-based content, we’ll also focus on metrics specifically designed for video evaluation.
If we talk about measuring Awareness KPIs, we can take under consideration two main metrics:
- Unique Visitors represent the number of distinct individuals who access the live shopping stream during a specific period, typically measured by unique IP addresses or user accounts.This KPI is essential for measuring the actual reach of a live shopping event. It provides a clear picture of audience size and potential market penetration, helping businesses assess the effectiveness of their promotional efforts.
Unlike total views, unique visitors give a more accurate representation of how many different people the stream has attracted. A high number of unique visitors suggests successful marketing, strong brand appeal, and effective channel selection. It indicates the potential for expanding the customer base and reaching new audiences.
-
Average viewing time represents the mean duration that viewers spend watching a live shopping stream, usually calculated by totaling the individual viewing times and dividing by the total number of viewers.
This metric is crucial for understanding audience interest and content quality. It reveals the stream’s ability to maintain viewer interest and provides insights into the effectiveness of the host, product presentation, and overall content. Longer average viewing times suggest compelling product demonstrations, an engaging host, and strong audience connection. Conversely, shorter viewing times might indicate a lack of viewer interest, poor content quality, or misalignment with audience expectations.
Businesses can use this metric to optimize content length, refine presentation strategies, and develop more captivating live shopping experiences. It serves as a direct indicator of how well the content resonates with the target audience, helping brands understand what keeps viewers watching and what might cause them to lose interest.
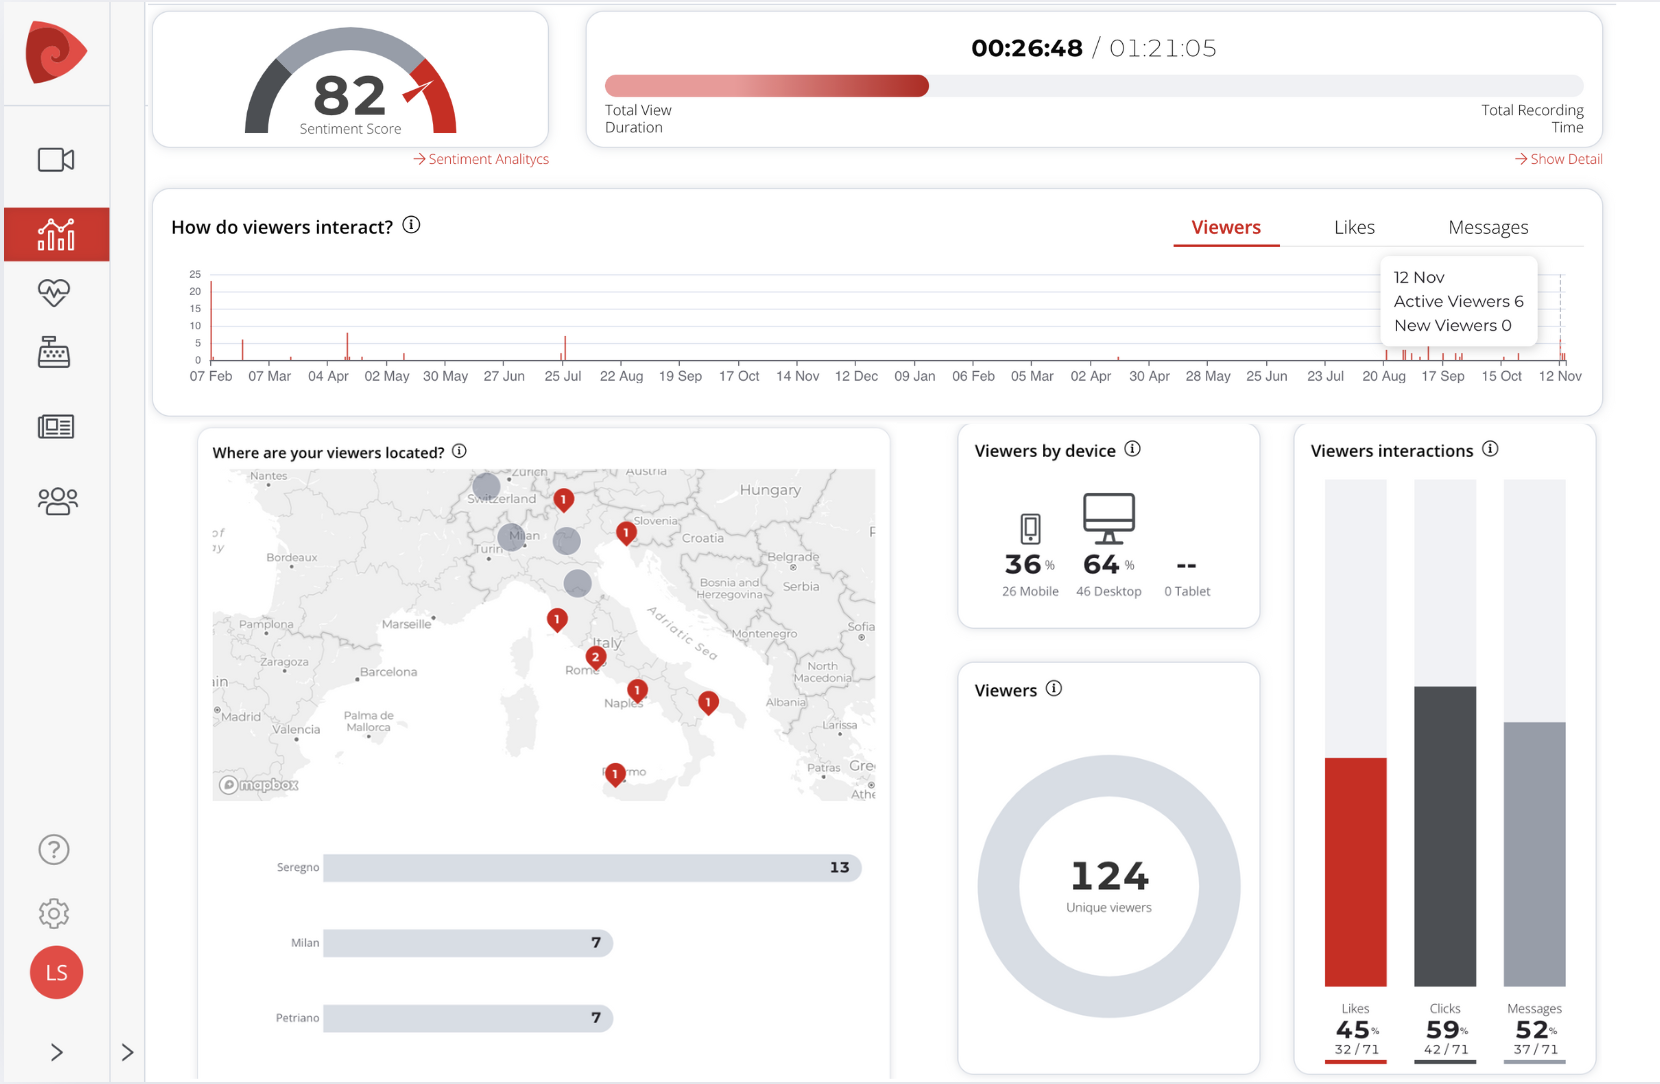
Live Shopping Interactions Matter: The Engagement Metrics
After a high-level performance overview, we need to dive deeper into specific aspects of the live shopping performance. The first aspect we need to focus on it’s the engagement level generated by the live streaming event. We can do so analyzing the following 2 metrics:
- Viewers interactions: When evaluating the success of a live streaming event, engagement serves as a crucial metric that provides valuable insights into audience behavior and connection. Within the realm of viewer interactions, we can observe various forms of engagement, such as comments, reactions, shares, and active participation in polls or Q&A sessions. These real-time interactions not only demonstrate audience involvement but also create a dynamic community atmosphere during the stream. The frequency and quality of these interactions often indicate how well the content resonates with viewers and whether they feel compelled to become active participants rather than passive observers.
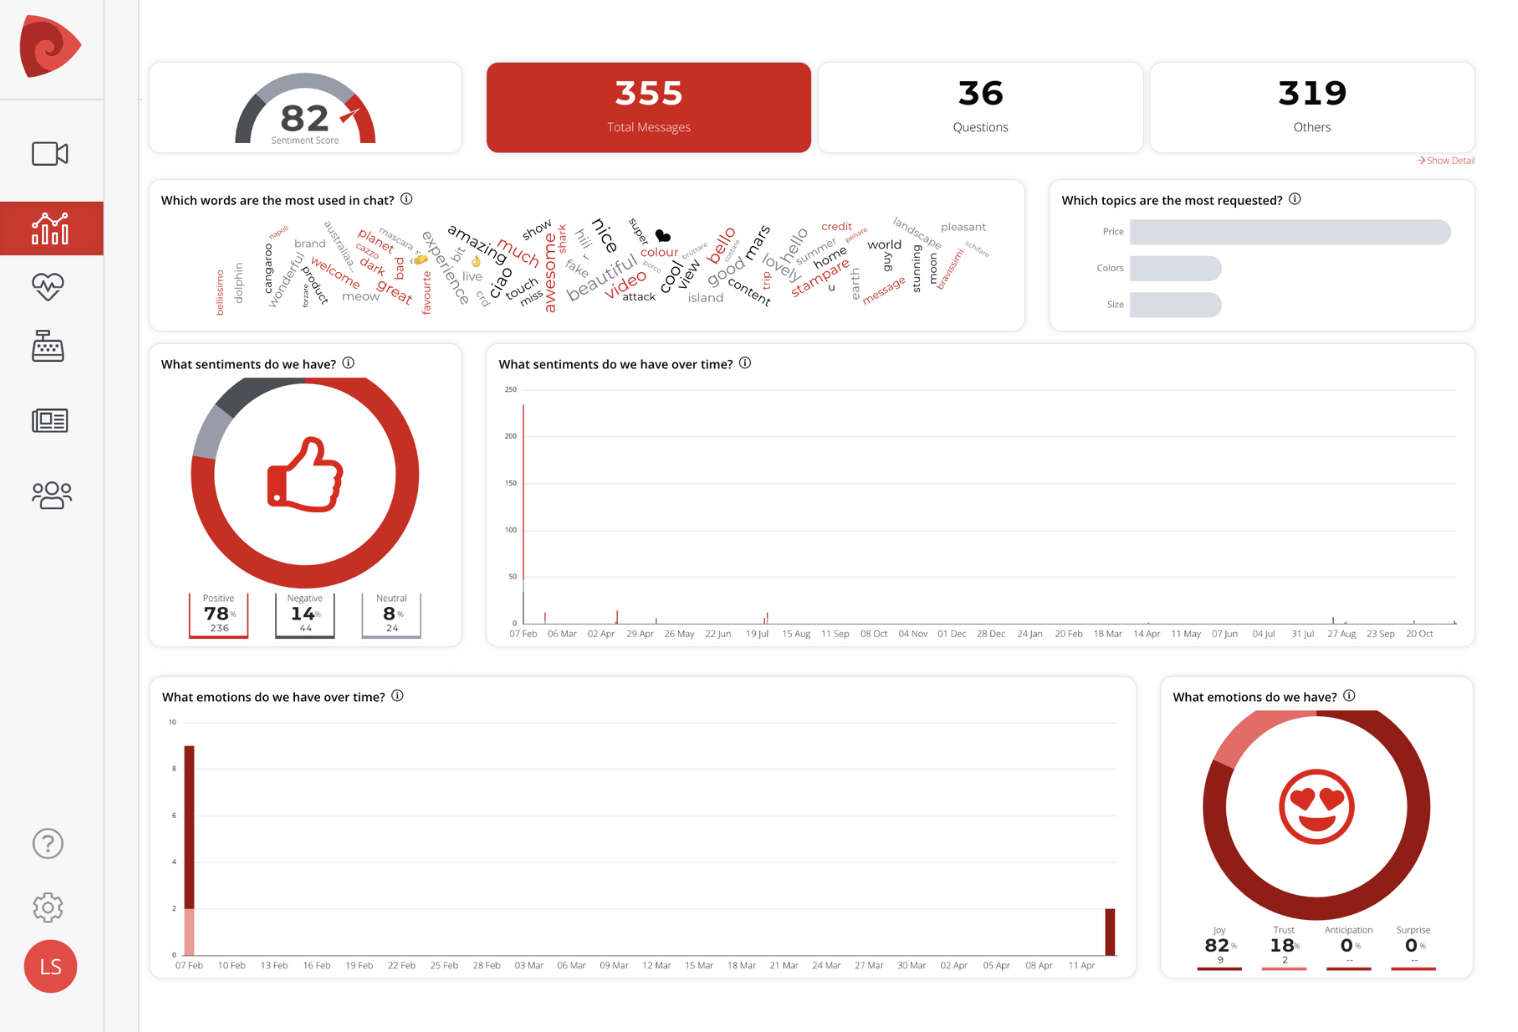
- Sentiment analysis adds another layer of understanding to the engagement metrics by revealing the emotional responses and attitudes of viewers toward the content. By analyzing the tone and context of comments, chat messages, and reactions, we can gauge whether the audience’s response is positive, negative, or neutral. This reveals what kind of content triggers enthusiasm or concern among viewers, enabling more informed decisions for future content planning.
Interactions during a live session not only provide insights into audience perception of the live stream itself. Closely linked to sentiment analysis is topic modeling. Thanks to advanced natural language processing capabilities, AI-powered live shopping platforms such as GOLIVE can provide insights into the topics most discussed by viewers, such as pricing. Through this metric, it is possible to understand which topics should be given more attention in future live sessions in order to better meet the needs of viewers.
The Success of a Live Shopping Event through Conversion Metrics
Understanding and analyzing conversion metrics becomes paramount for businesses aiming to evaluate and optimize their live event performance. These metrics serve as crucial indicators of the actual business impact of live shopping events.
- The number of purchases metric provides a straightforward count of individual transactions completed during the live event. This raw number helps businesses understand the actual volume of sales generated, regardless of the audience size. In addition to this metric, it is also possible to identify the amount of individuals who made purchases during the live session. Moreover,a live shopping platform can provide a breakdown of the purchased items, making it possible to identify which products triggered the most buying actions.
- Total revenue from purchases completes the array of essential conversion metrics, representing the actual monetary value generated during the live shopping event. This metric goes beyond simple transaction counts by revealing the financial impact of the event. By analyzing total revenue alongside the number of purchases, businesses can derive valuable insights about average order values and understand whether their live shopping strategy effectively encourages larger basket sizes or primarily drives smaller, impulse purchases.
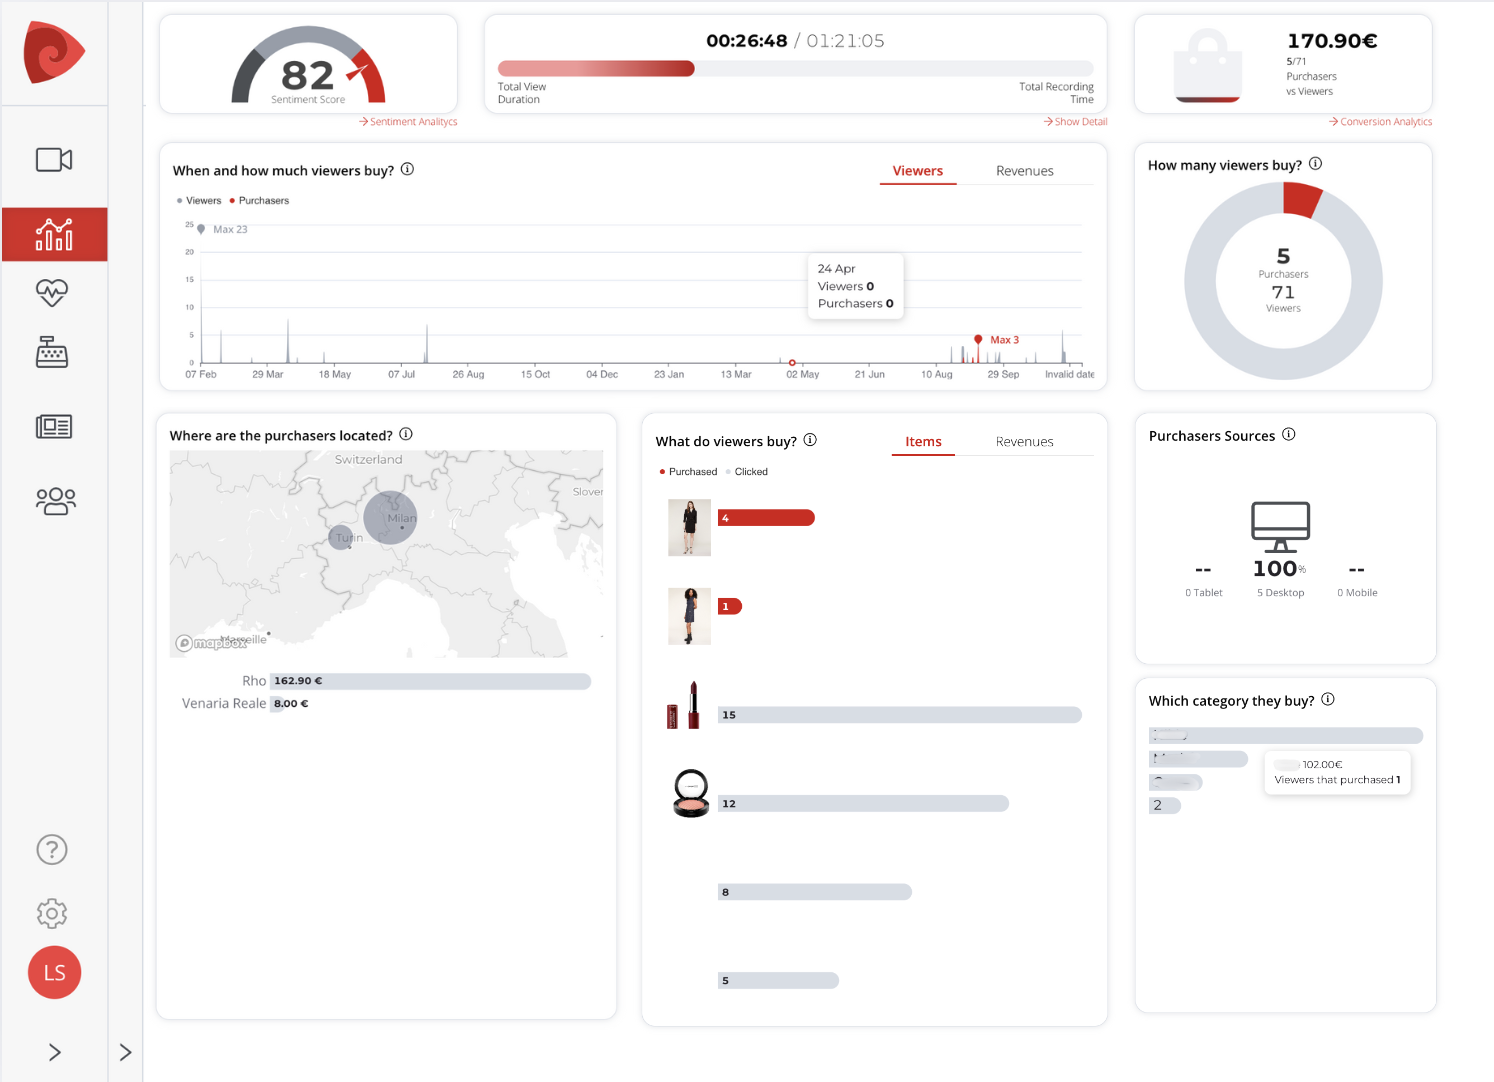
Of course evaluating these metrics together is essential to get a comprehensive picture about a live shopping event’s commercial success.
For example, a high conversion rate paired with low total revenue might suggest the need to adjust pricing strategies or product mix, while high total revenue with a lower conversion rate could indicate success in attracting high-value customers who make larger purchases.
Conclusion
Choosing the right KPIs is crucial for businesses to measure their success and make informed decisions. By focusing on key performance indicators that align with specific goals, businesses can track progress, identify areas for improvement, and optimize their strategies. Effective KPIs provide valuable insights into the overall health of a business and enable data-driven decision-making.
The initial step to drive live commerce results is to select a live shopping platform equipped with a user-friendly dashboard that allows for easy visualization and monitoring of all key performance indicators.
GOLIVE is the live shopping platform with an intuitive design that provides an effective visualization of all the metrics discussed in the blog post. However, the KPIs offered by the platform go far beyond those mentioned, ensuring a comprehensive overview of the performance of your live shopping project. Moreover, the metrics are available not only in real-time but also in aggregated and granular form, guaranteeing the completeness of the information available.
Start driving eCommerce sales and making informed decisions with GOLIVE now!